Haplocheck
Haplocheck detects contamination patterns in mtDNA AND WGS sequencing studies by analyzing the mitochondrial DNA. Haplpcheck also works as a proxy tool for nDNA studies and provides users a graphical report to investigate the contamination further.
Availability
Run a job using our cloud web service or click here to download a local version.
Run Haplocheck locally
VCF Input
The run haplocheck on a VCF file, homoplasmic genotypes must be coded as “1/1” and heteroplasmic genotypes as “0/1”. You can create such a VCF be starting haplocheck from BAM files (see mutserve) or use a state-of-the-art variant caller like GATK MuTect2.
mkdir haplocheck
 wget https://github.com/genepi/haplocheck/releases/download/v1.3.2/haplocheck.zip
 unzip haplocheck.zip
 ./haplocheck --out <out-file> <input-vcf>
BAM Input
When running haplocheck from BAM input, an additional step for variant calling must be executed. For variant calling, mutserve has been integrated that allows the detection of heteroplasmic and homoplasmic sites down to 1 %.
The workflow (BAM -> VCF, VCF -> Contamation Report) has been integrated into Cloudgene.
curl -s install.cloudgene.io | bash -s 2.3.3
./cloudgene install https://github.com/genepi/haplocheck/releases/download/v1.3.2/haplocheck.zip
Run Haplocheck as a service
We integrated haplocheck into our cloud web service mitoverse allowing users without access to a command line to use it.
Example (VCF Input)
#Download 1000G Phase3 Data generated by mutserve
wget https://github.com/genepi/haplocheck/raw/master/test-data/contamination/1000G/all/1000g-nobaq.vcf.gz
 ./haplocheck --out 1000g-results 1000g-nobaq.vcf.gz
firefox 1000g-results/report/report.html
Example (BAM Input)
#Create folder
mkdir bam-input
cd bam-input

#Download 1st BAM file
wget https://github.com/seppinho/mutserve/raw/master/test-data/mtdna/bam/input/HG00096.mapped.ILLUMINA.bwa.GBR.low_coverage.20101123.bam
wget https://github.com/seppinho/mutserve/raw/master/test-data/mtdna/bam/input/HG00096.mapped.ILLUMINA.bwa.GBR.low_coverage.20101123.bam.bai

#Download 2nd BAM file
wget https://github.com/seppinho/mutserve/raw/master/test-data/mtdna/bam/input/HG00096.mapped.ILLUMINA.bwa.GBR.low_coverage.20101123_2.bam
wget https://github.com/seppinho/mutserve/raw/master/test-data/mtdna/bam/input/HG00096.mapped.ILLUMINA.bwa.GBR.low_coverage.20101123_2.bam.bai

cd ..

#Run haplocheck with 2 threads
./cloudgene run haplocheck@1.2.2 --files bam-input --format bam --output results  --threads 2

#Open results in Browser
firefox results/report/report.html
Output Format
Haplocheck reports the contamination status for each mitochondrial input sample and creates (a) a graphical report (Example Report) and (b) a textual description (Example Contamination File).
Graphical Report
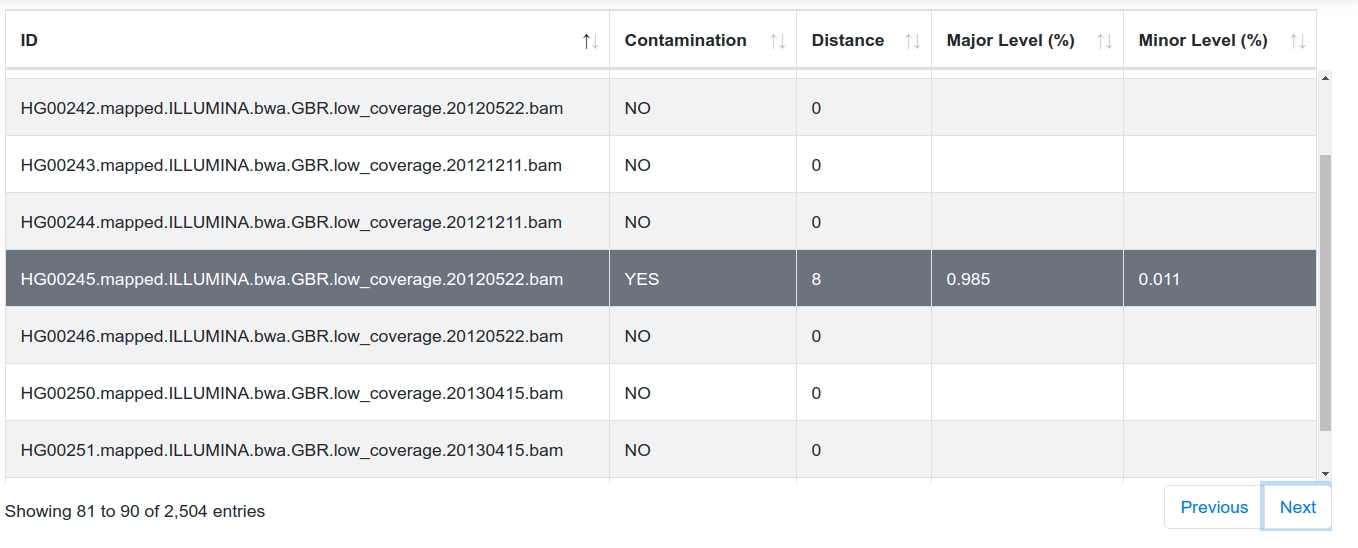
The graphical report includes the most important information from the textual result file (see Textual Report File below). The table can be filtered, sorted and searched by specific samples. Additionally, for each sample a phylogenetic tree is generated using the graph information from Phylotree 17.
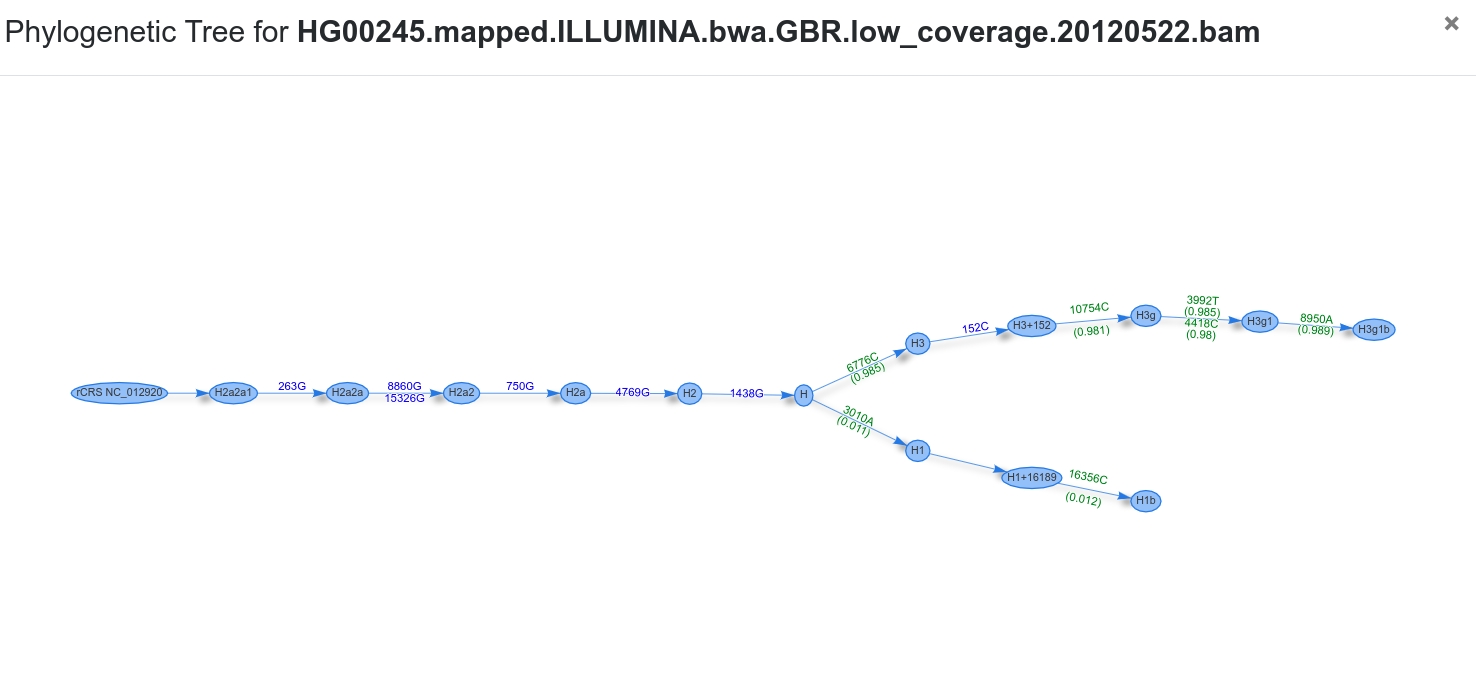
Phylogenetic Tree
The tree starts at the root node (rCRS) and shows homoplasmic (blue) / heteroplasmic (green) positions for each transition until the final haplogroup (as assigned by Haplogrep) has been reached. The two branches represent the final haplogroups of the major and minor profile. In our case the two profiles are H1b and H3g1b.
Textual Report File
Haplocheck provides two text files (contamination.txt and contamination.raw.txt) including all required information is created by haplocheck.
The following columns are included in the tab-delimited file (The header corresponds to the column name)
Sample
This column includes the sample identifier.
Contamination Status
Haplocheck works by splitting each input sample into two profiles, the so called major and minor component. Homoplasmies are always added to both profiles, heteroplasmies are split and added to the correct profile. Depending on several internal parameters (e.g. distance between haplogroups, number of heteroplasmies), haplocheck assigns a contamination status to each sample. This column can either be YES, NO or ND (not detectable).
Distance
This column defines the distance between the haplogroups of the major and minor profile using the graph structure of Phylotree 17. In the sample above, the distance would be 8 (Nodes between H1b and H3g1b).
Contamination Level
The detected contamination level for the sample.
Sample Coverage
The columns defines the mean coverage for the sample.
Textual Report File Raw
The following columns are additionally available in contamination.raw.txt:
Overall Homoplasmies
Total number of included homoplasmies in the sample.
Overall Heteroplasmies
Total number of included heteroplasmies in the sample.
Major Heteroplasmy Level
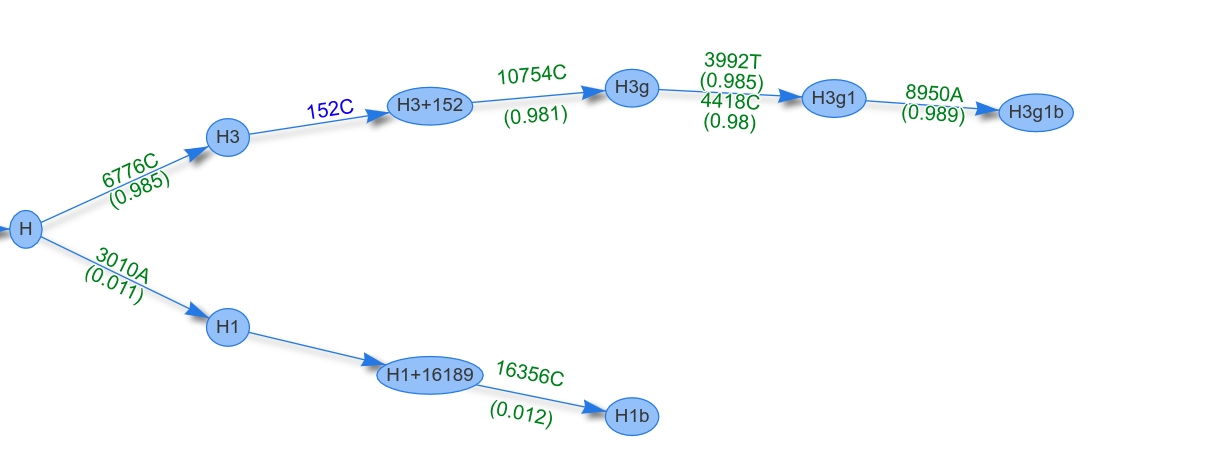
The major heteroplasmy level is calculated by averaging the level of each heteroplasmy (major components only). Additionally, only heteroplasmies from the common ancestor (so in our sample node H) are added to the level. The figure below shows the phylogenetic graph of sample HG00245. H is the common ancestor for both profiles, therefore only the heteroplasmies 6776C (0.985), 10754C (0.981), 3992T (0.985), 4418C (0.98) and 8950A (0.989) are used for the level calculation. By averaging all levels, a final major level of 0.984 is assigned.
Minor Heteroplasmy Level
The minor heteroplasmy level is calculated by averaging the level of the minor component of each heteroplasmy. The sample HG00245 includes two minor components (3010A (0.011), 16356C (0.012)) to calculate the final heteroplasmy level of 0.011.
Major Haplogroup
The major haplogroup is calculated by using Haplogrep. The input profile includes all homoplasmies and the major component of each heteroplasmy.
Major Haplogroup Quality
This columns includes the haplogroup quality (provided by Haplogrep). Click here for details how the metric (so called Kulczynski measure) is calculated.
Minor Haplogroup
The minor haplogroup is calculated by using Haplogrep. The input profile includes all homoplasmies and the minor component of each heteroplasmy.
Minor Haplogroup Quality
This columns includes the haplogroup quality score (provided by Haplogrep). Click here for details how the metric (so called Kulczynski measure) is calculated.
Major Homoplasmies Count
Number of homoplasmies included in the major haplogroup. Please keep in mind that Haplogrep assigns the best haplogroup hit by traversing through the graph. Therefore not always all homoplasmies or heteroplasmies (as defined in the input profile) are required for the best hit.
Minor Homoplasmies Count
Number of homoplasmies included in the minor haplgroup.
Major Heteroplasmies Count
Number of heteroplasmies included in the major haplgroup.
Minor Heteroplasmies Count
Number of heteroplasmies included in the minor haplgroup.
Clusters
All heteroplasmies are clustered using the Jenks natural breaks classification method. This information is provided to the user to see the identified clusters by haplocheck.
Contamination Method
Haplocheck works by detecting two different components (or mitochondrial haplotypes) within one sample. Each heteroplasmic position is split into two components and added to a major and minor profile. Additionally, homoplasmic positions are added to both profiles. Each profile is then classified into a haplogroup. Since Haplogrep detects two components, we always output the contamination level of the minor and major component.
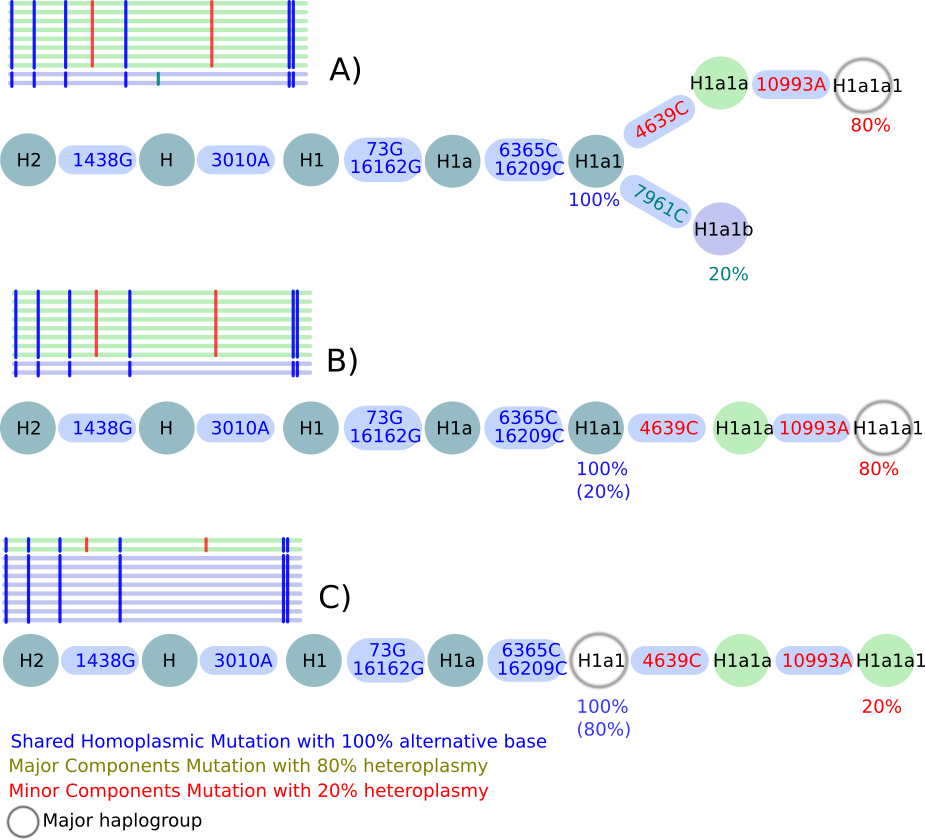
When analysing the output, three different scenarios are possible (see Figure):
Scenario A
In this scenario haplocheck is able to identify a major and minor haplotype: The homoplasmic mutations (marked in blue) are present in both haplotypes and defining haplogroup H1a1. Three additional heteroplasmic positions are included in the sample. Haplocheck detects the minor haplogroup H1a1b including 7961C with 20% (i.e. included in 20 % of the reads) and the major haplogroup H1a1a1 including 4639C + 10993A with 80 % (i.e. included in 80 % of the reads).
Scenario B
This scenario describes a mixture of two haplotypes within a single lineage but of different lineage depths. Again, the homoplasmic positions define the haplogroup H1a1. Two additional heteroplasmies 4639C + 10993A have been detected with 80 % which define the major haplogroup H1a1a1. No minor haplotype has been detected using the available heteroplasmic mutations. Therefore, the final minor haplotype is included in H1a1.
Scenario C
This scenario describes again a mixture of two haplotypes within a single lineage but of different lineage depths. Again, the homoplasmic positions define the haplogroup H1a1. Two additional heteroplasmies 4639C + 10993A have been detected with 20 % which define the minor haplogroup H1a1a1. No major haplotype can be detected using available heteroplasmic mutations. Therefore, the final major haplotype is included in H1a1.
## FAQ
What is the difference b/w overall homo/heteroplasmies and number major/minor homo/heteroplasmies?
Overall homoplasmies/heteroplasmies count the number of variants found in a sample. E.g. sample 17.bam includes 10 homoplasmic variants and 8 heteroplasmic variants. Haplocheck splits the variants into two profiles, the so called major and minor profile. The major profile includes all homoplasmies (10) and the major allele of each heteroplasmy. The minor profile includes again all hoomoplasmies (10) and the minor allele of each heteroplasmy. For both profiles, the haplogroup is calculated using Haplogrep. Ideally, all variants are used and a quality score of 1 is reached by Haplogrep. Since neither the input profile nor the phylogeny is perfect, some of the input homoplasmies or heteroplasmies are missed by Haplogrep. This results in a Haplogrep quality score between 0.5 and 1. The columns major/minor homoplasmies/heteroplasmies count the number of variants that have been finally used for the best haplogroup hit and can therefore differ from the overall homoplasmies/heteroplasmies.
What does the heteroplasmy level represent?
The heteroplasmy level denotes the averaged allele frequency (VAF) and is calculated for both the major heteroplasmic allele (column Major Heteroplasmy Level) and minor heteroplasmic allele (column Minor Heteroplasmy Level).
How is the heteroplasmy level calculated?
The major and minor heteroplasmy level is calculated by averaging the allele frequency of both alleles. Only heteroplasmies from the most previous common ancestor are used for this calculation. For example, if H1a1 is the common ancestor of the profiles H1a1a1 (major) and H1a1b (minor), only heteroplasmies starting from H1a1 are included for calculation. Furthermore, we only add heteroplasmies with a mutation rate > 5 (as defined by HaploGrep) and excluding back mutations as well as deletions on heteroplasmies.
How is the label contamination (YES versus NO) decided exactly?
Haplocheck uses the mitochondrial phylogeny and the concept of haplogroups to identify contamination. It is heavily based on Haplogrep and Mutserve. Mutserve allows to detect low-level variants (or in case of mtDNA so called heteroplasmies) down to the variant level of 1 %. Haplocheck splits the input into two profiles and calculates the haplogroup for each profile using Haplogrep. Identical haplogroups are marked with the contamination status of NO. If the haplogroup between two profiles differ, high confident heteroplasmies are determined by haplocheck and the distance between the two profiles is calculated. Depending on the (a) number of heteroplasmies, (b) haplogroup quality score and (c) distance between two profiles a YES or NO label is assigned. To assign a correct YES/NO labels contamination can be occur on (a) two separate branches (b) same major branch or (c) same minor branch. Please also have a look at the contamination method itself to learn about different kinds of contamination.
How did you evaluate Haplocheck?
To find the best setup, we created and analyzed in-silico data by mixing random profiles from the currently best available mtDNA phylogeny derived from Phylotree. In total, 6 different datasets (3 datasets with 500,000 mixtures each, 3 datasets with 100,000 mixtures each) have been created and the F1-Score (defined as 2 x precision x sensitivity / (precision + sensitivity)) has been calculated to analyze the overall accuracy of haplocheck. To evaluate the overall performance of haplocheck on a real data set, we re-analyzed 1KGP Phase 3 (n = 2,504) and compared our results with the publicly available data regarding contamination status derived from verifyBamID.
How to cite
Weissensteiner H, Forer L, Fendt L, Kheirkhah A, Salas A, Kronenberg F, Schoenherr S. 2021. Contamination detection in sequencing studies using the mitochondrial phylogeny. Genome Research. http://dx.doi.org/10.1101/gr.256545.119.